
Digging into LeoVegas’ slot push

After MGM’s acquisition of LeoVegas last year, LeoVegas – which is now part of MGM – has announced the acquisition of Push Gaming for a rumoured $150m (£119.7m/€135.8m).
Clearly this latest purchase was part of a bigger content strategy all along. Once you reach a certain size, it seems, the metrics of in-house content creation make more sense.
And it looks as though 12 years of hard work are finally paying off for the founders of Push Gaming, which is especially good news for the creative arm of our industry.
The relentless pace of game output and new studio launches has meant less shelf space per studio and per operator. There has also been an increasing number of games per operator and thus real margin pressures. Only a couple of weeks ago we witnessed the high profile closures of Funfair Games and Green Jade Games.
So how do the numbers stack up and what is this acquisitive operator looking to achieve when buying up the value chain?
Why Push Gaming?
First up is an overview of the target company. With a UK base, licence and workforce, Push Gaming is neither a small nor cheap operation.
While they once outsourced some game production components to the likes of Yarki or Ace Gaming and ported some land-based titles from Magic Dreams, they are now focussed on the in-house creation of higher quality titles. Even their acquisition of platform provider GSI in 2020 didn’t distract them from their studio-first ambitions.
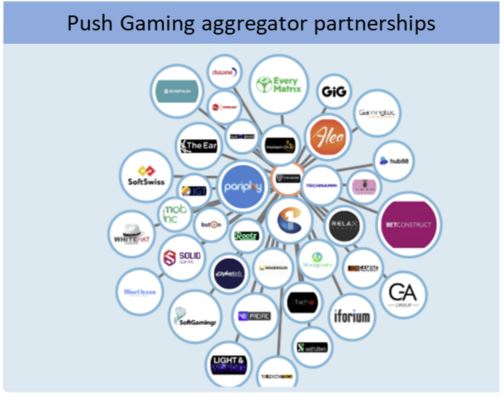
They now have nearly 50 games live across 450 sites and, while we don’t know the numbers of sites that are direct integration partners, the studio distributes content via 47 aggregators.
| Target company name | Push Gaming |
| Target Company Type | Studio |
| Acquirer | LeoVegas (MGM) |
| Acquirer Type | Operator |
| Founded | 2010 |
| Licences | Malta, Ontario, Romania, UK |
| Base | UK |
| Staff | 127 |
| Aggregator/platform partners | 37 |
| Games shown on Push Gaming’s site | 30 |
| Games found across operator sites 2023 | 47 |
| Operators featuring their live games | 459 |
The output of games is less than the average of one per month. But the company has focussed on quality and, as a result, the games do perform better than those from the average studio.
The table below compares Push Gaming to the average studio across metrics such as game distribution (the number of live sites and live URLs where content is found), average position on page and the average number of games, split down further by all sites versus Tier 1 and 2 operators.
| Site distribution and positions on page | All operators Push Gaming | Tier 1 and 2 operator groups Push Gaming | All operators All studio gps | Tier 1 and 2 operator groups All studio gps |
| Operator sites featuring games | 459 | 277 | 120 | 84 |
| Number of URLs featuring their games | 1332 | 825 | 290 | 258 |
| Average position on page with 1 being at top | 493 | 421 | 849 | 763 |
| Average number of games on sites | 47 | 46 | 56 | 52 |
Across the industry
Overall, Push Gaming is well above average in terms of numbers of sites and URLs where games are found, as well as position on page. However, things are slightly below average in game portfolio and output. They sit just outside the top 50 studio groups when measured in distribution terms or on page position, so they are not a major player – but not an insignificant one either.
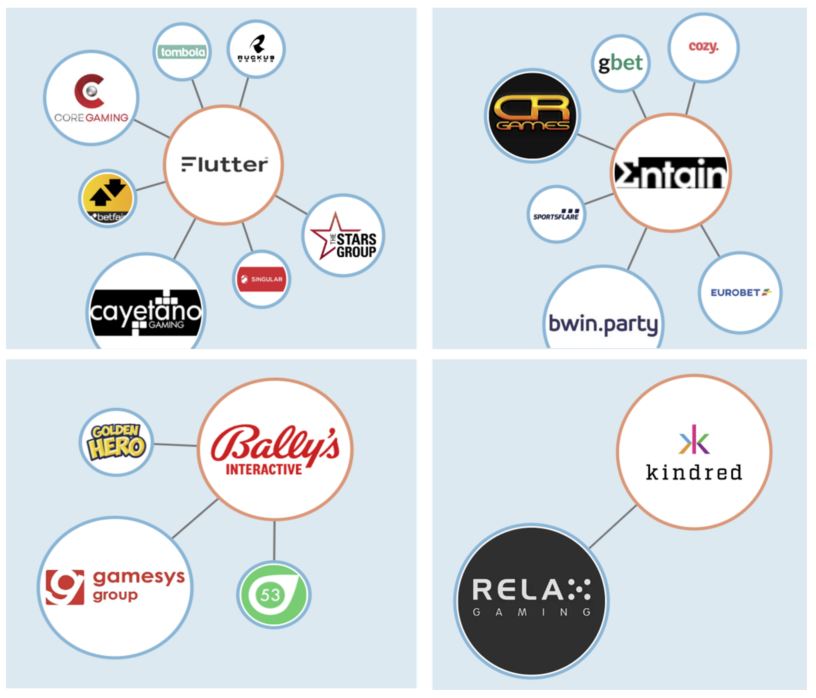
Similarly, when the likes of Flutter or its subsidiaries acquired Core Gaming and Cayetano, or when Entain acquired CR Games, these weren’t the largest studios either.
The diagram below shows some suppliers that have been rolled up into operator groups over the years.
The next table gives a detailed view of game position and distribution data, comparing Push Gaming to the average studio group across a handful of Tier 1 or 2 operators.
In terms of game position, they perform well on operator groups such as Kindred, Videoslots, SkillonNet and Bally’s Corporation. In terms of share of total shelf space, they perform best on the likes of Cherry AB, Bally’s Corporation and, of course, MGM.
| Large operator group | Average page position of games Push Gaming | Average page position of games All Studio Groups | % vs average | Push share of total content across sites |
| 888 | 1,034 | 638 | -62% | Outside top 20 |
| Entain | 790 | 509 | -55% | Outside top 20 |
| Flutter | 161 | 149 | -8% | Outside top 20 |
| Rank | 682 | 406 | -68% | Outside top 20 |
| SkillOnNet | 385 | 562 | 31% | Outside top 20 |
| Kindred | 18 | 28 | 36% | Outside top 20 |
| Betsson | 425 | 780 | 46% | Outside top 20 |
| Cherry | 54 | 47 | -15% | Top 10 |
| MGM | 451 | 868 | 48% | Top 25 |
| Svenska Spel | 88 | 98 | 10% | Top 20 |
| Videoslots | 121 | 175 | 31% | Top 20 |
| Bally’s | 288 | 313 | 8% | Top 20 |
| Average all sites | 493 | 849 | 42% | Outside top 20 |
| Average T1 and T2 sites | 421 | 763 | 45% | Outside top 20 |
The acquirer has picked up a supplier which ranks in its own top 25 studios in terms of content across site and whose games outperform the average in terms of position on page.
Fair enough if the intention is to bring a portion of game content in-house and there’s plenty of scope here for exclusive content and lower third party revenue shares. But how does it compare to similar operator-studio acquisitions in the past and what might we expect to see in the future?
In-house studios
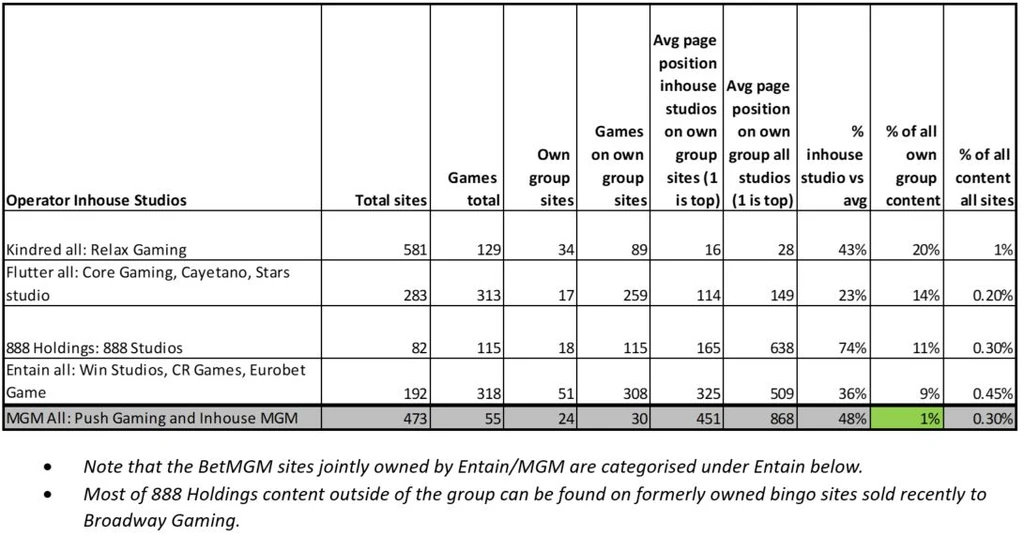
The table below contrasts MGM with four top operator groups that have either acquired or created studios in-house. Most acquiring operators continue to allow their in-house studios to service competing operators, though often ensuring that games debut exclusively for a period in-house.
In this sense, it is likely that MGM will allow Push Gaming to continue to do the same too. After all, much of the touted $150m value of the company will be in its third party operator revenues.
More than anything, this table highlights quite clearly where the opportunity lies in bringing content creation in-house. Most studio groups reserve between 10% and 20% of game content for in-house studios. From a 1% start, MGM now has serious scope to do the same.
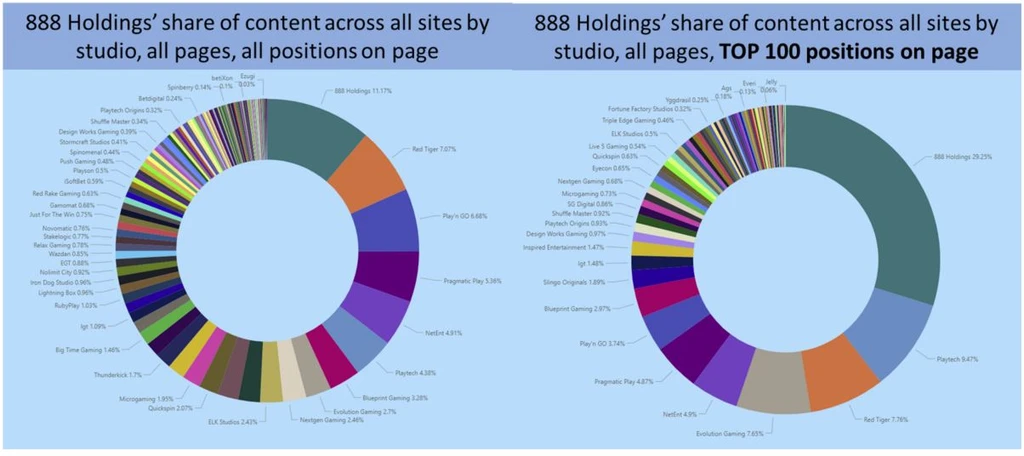
The diagram below paints a similar picture, but using one major operator group as an example. 888 Holdings dedicates 11% of all casino space to in-house game content, but 30% of prime real estate on site.
Without more detail on actual revenues and earn-outs, it is difficult to assess the touted $150m valuation.
However, the numbers above do show the true scale of the opportunity. If you were to overlay MGM casino revenues x 20% x average third party revenue shares of 10%, then that headline figure doesn’t look quite so lumpy.
The ability to dedicate up to 10-20% of content – or yet more of the prime positions on page – to their new in-house studio will have an immediate impact on Push’s revenues and/or the cost of third party content for MGM. We look forward to revisiting the numbers post integration.
Egamingmonitor.com tracks the distribution of 47,000 games from 650 studios across 10,000 URLs of 2,400 operators globally, including positions of content on page. To access 50+ charts which include rankings and distribution of all game types including live, crash and table games across all subpages and to filter game performance by game theme, game feature or by operator type, get in touch.