
Why unified analytics are critical for player retention
Why has a unified analytics dashboard become essential for operators focused on retention?
The data available to operators today can unlock essential information on retention, but it must be processed efficiently as an operational necessity. Operators may acquire traffic effectively, but sustainable growth depends on understanding how players behave after registration. The challenge is that most operators still rely on fragmented reporting systems, with one dashboard for KPIs and another for game data, separate fraud tools, CRM exports and manual ticket investigations. This fragmentation slows decision-making. By the time churn or suspicious activity is identified, the player may already be lapsed or risk may have escalated.
A unified analytics dashboard removes this friction. When gameplay data, financial metrics, device usage and flagged behaviour are visible on one interface, insight becomes immediate and actionable.
Hub88’s Player Analytics dashboard is built directly into our Operator Backoffice, meaning retention analysis is not separated from daily operations. Teams do not need to export data, cross-reference IDs or switch between tools. They can segment players broadly and investigate individuals within the same ecosystem.
For operators serious about retention, speed of insight is a competitive advantage. A unified dashboard transforms analytics from a reporting function into a real-time operational tool, enabling faster interventions, smarter segmentation, and ultimately longer player lifecycles.
What operational challenges typically signal that an operator needs this kind of dashboard?
There are several clear indicators. The first is investigation fatigue. If a support or risk team needs to jump between multiple reports to validate a single player case, copying player IDs, checking devices separately, reviewing supplier logs independently, efficiency is low.
The second is reactive retention. If marketing teams rely solely on periodic BI reports rather than live behavioural insights, churn detection becomes delayed. High-value players may quietly reduce activity over weeks before anyone notices.
The third is limited cross-functional visibility. Fraud, CRM, customer support, and operations often look at different datasets. Without a shared interface, departments form partial conclusions.
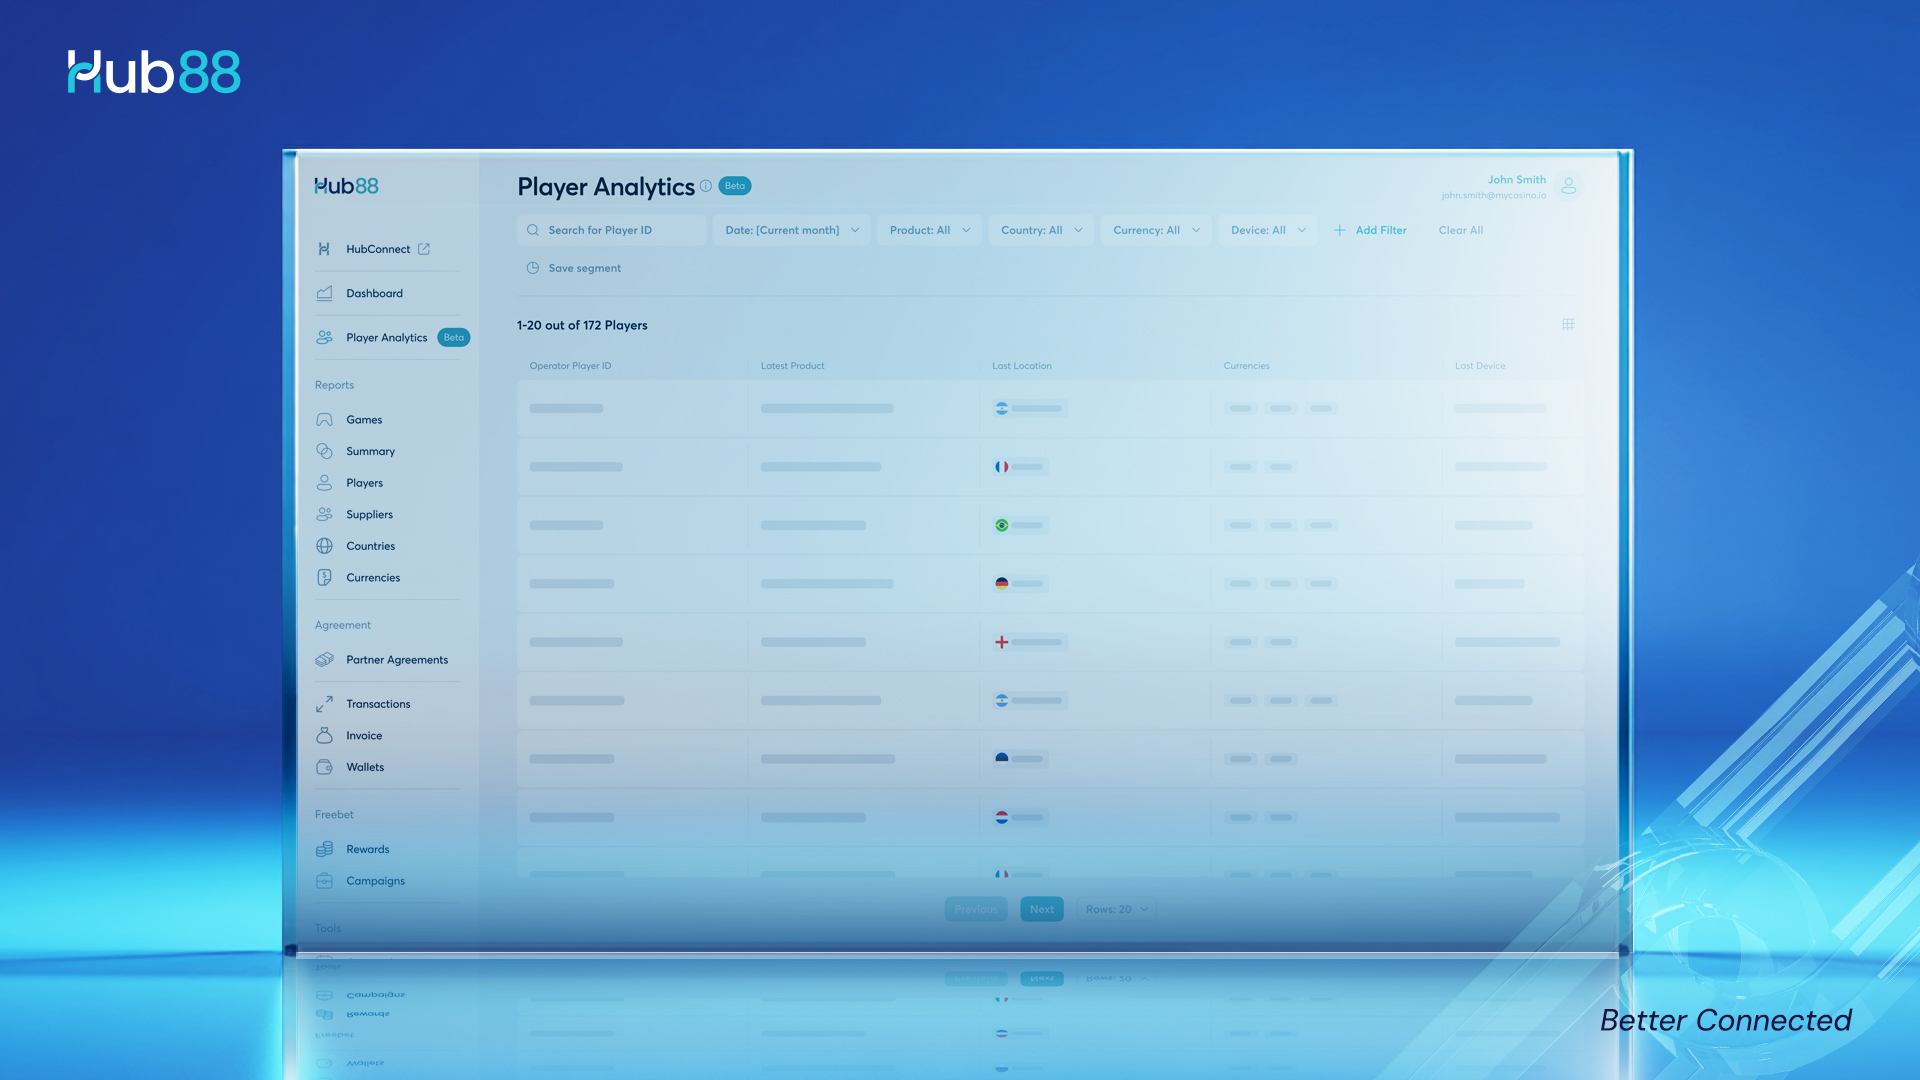
Hub88’s Player Analytics addresses these pain points through two core views: the Table View and the Player Profile. The Table View allows broad segmentation, including date, product, country, currency, device, and operator filters, and saves those filters as reusable segments. This alone reduces reliance on external BI exports.
But the real operational shift happens when segmentation and investigation sit side by side. Teams can identify a behavioural pattern in seconds, click into a profile, and immediately view performance trends, supplier distribution, device shifts, or flagged activity without leaving the Backoffice. When investigation time shrinks and insight is shared across departments, friction decreases significantly.
How deep can modern player insights realistically go?
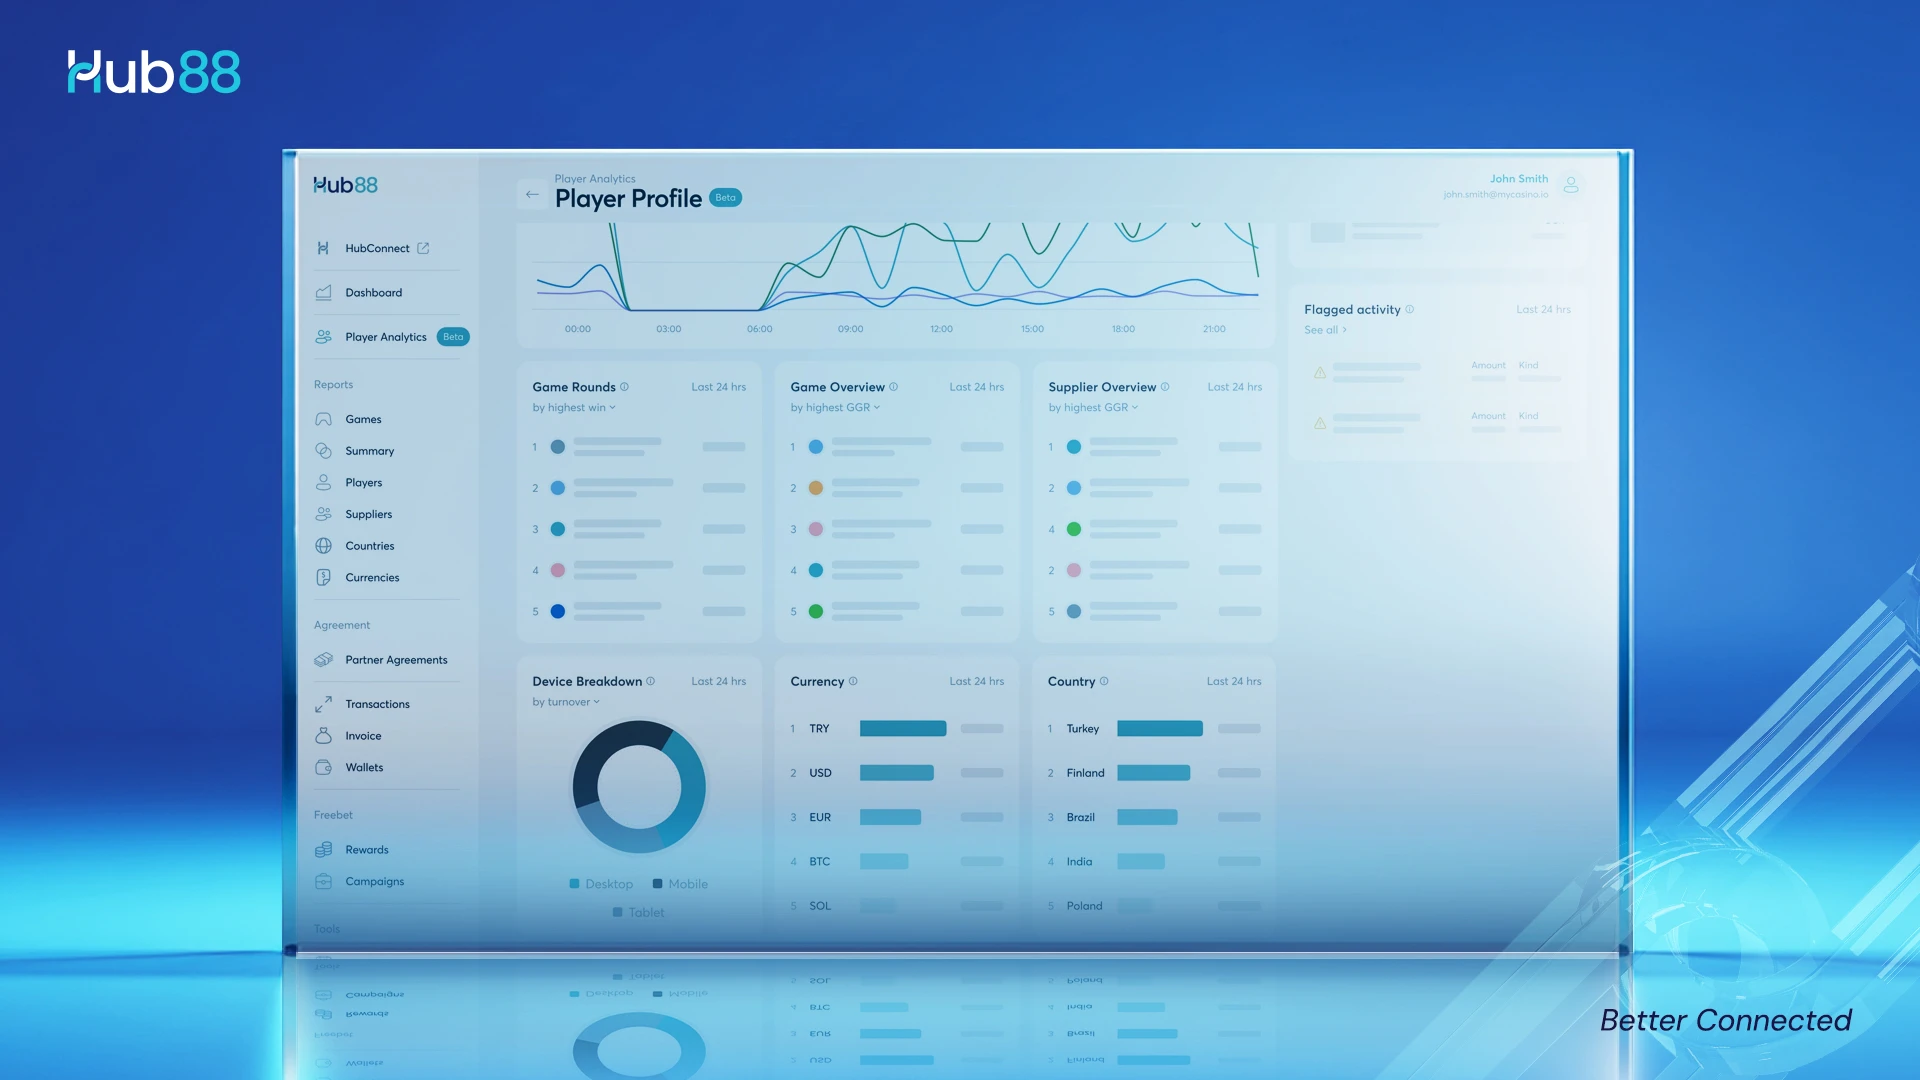
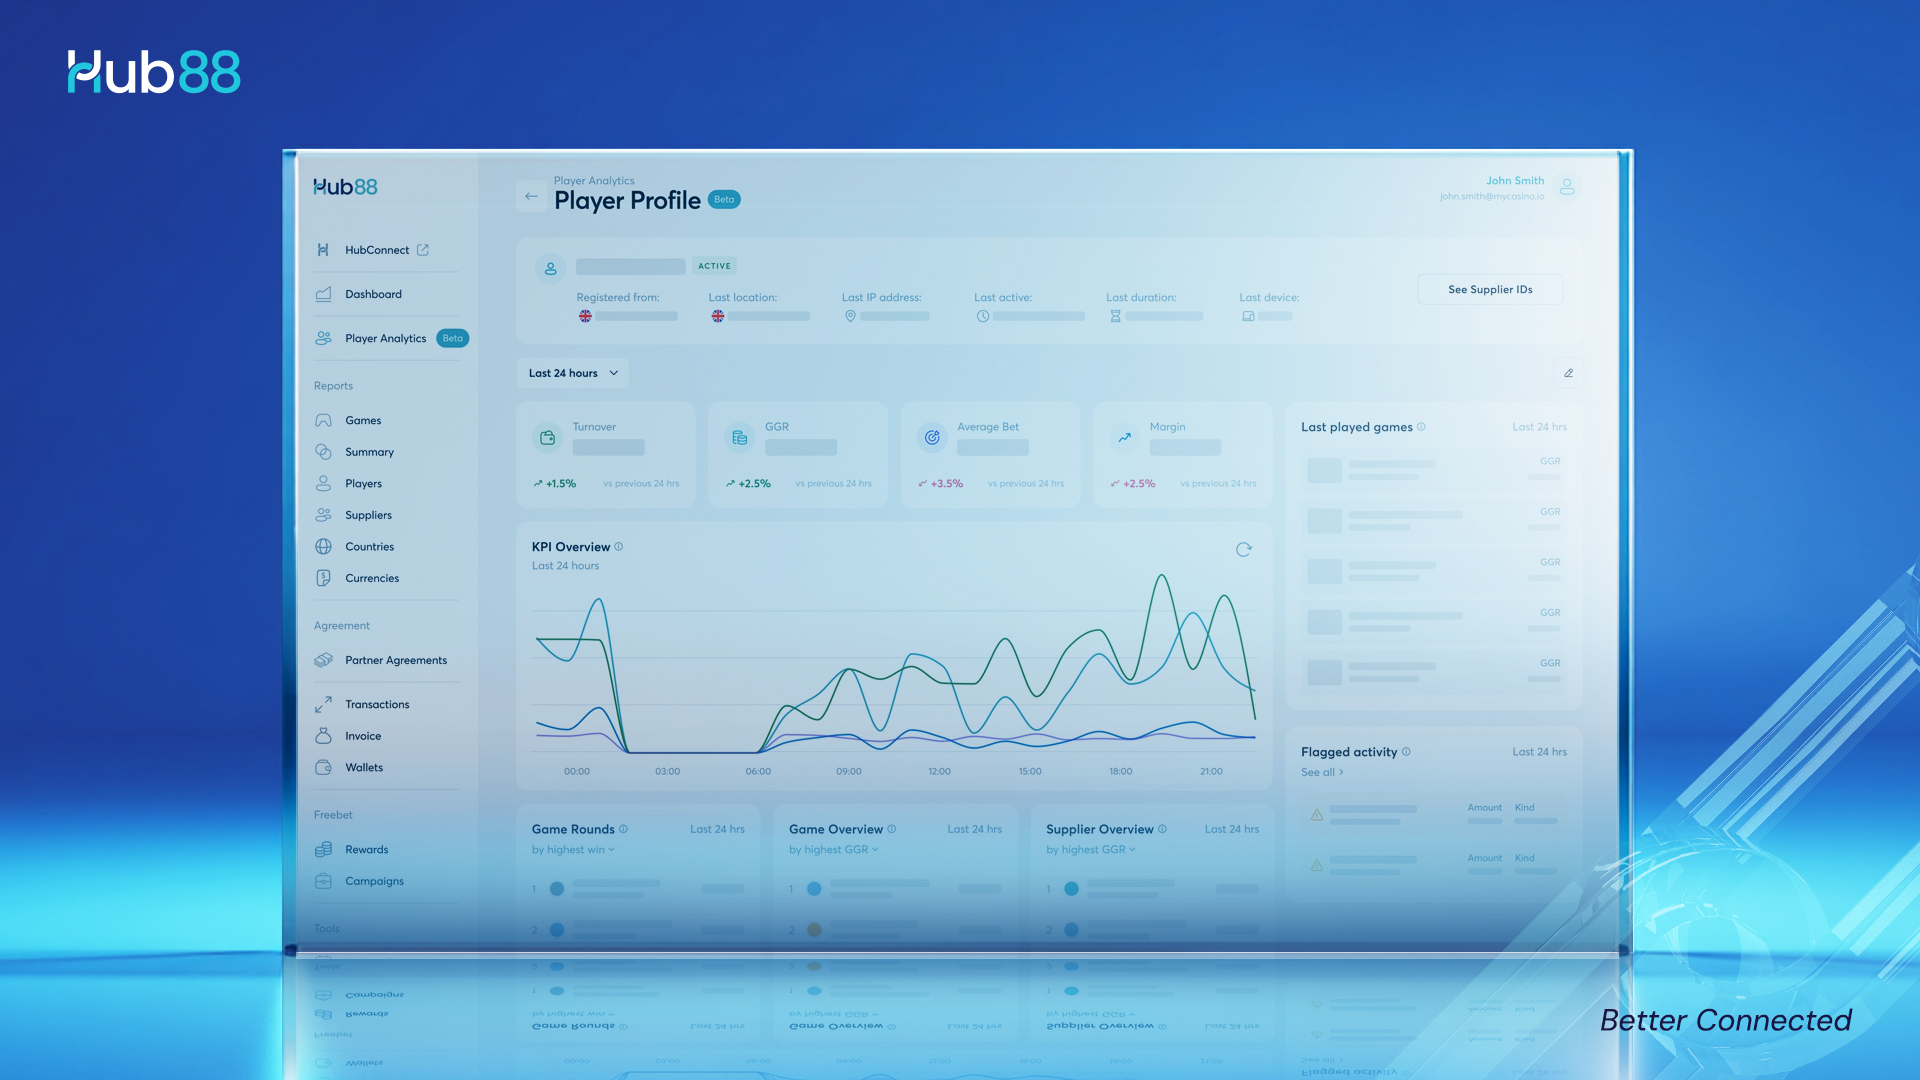
Modern analytics must go beyond surface KPIs like total bets or GGR. True depth lies in their behavioural context. Within the Player Profile, Hub88 provides a layered view of activity. At a glance, operators can see registration origin, last activity timestamp, session duration, and device type. From there, customisable chart blocks allow teams to analyse KPIs, game rounds, supplier distribution, device breakdown and flagged alerts.
Depth becomes meaningful when multiple data sources are viewed together. For example:
- A sudden spike in wins alongside flat betting patterns may signal a large jackpot or potential irregularity.
- A steady 30-day decline in GGR from a historically high-value player may indicate early churn risk.
- A player spending 90% of activity with one supplier reveals strong vertical preference, perhaps live casino over slots, guiding smarter marketing alignment.
Insights are not isolated metrics; they are narratives. By switching timeframes from today to the last three months, teams can contextualise short-term volatility against longer-term behaviour.
The depth lies not only in data volume, but in the ability to interpret behavioural shifts quickly. That is where unified dashboards move beyond reporting and into strategic retention intelligence.
What makes Hub88’s approach different from traditional BI reporting tools?
Traditional BI tools are powerful but often detached from daily workflows. They typically require exports, technical configuration or specialist analysts to interpret the data. For many operators, that creates a bottleneck between insight and action.
To reduce context switching, Hub88’s Player Analytics is embedded directly into the Operator Backoffice — the same environment teams already use for game management, transaction monitoring, and operational reporting.
The dual-structure design is also distinctive. The Table View enables high-level segmentation across six months of data with filters by operator, product, country, currency, and device. Filters can be saved as reusable segments, allowing teams to revisit strategic cohorts instantly.
From there, a single click opens the Player Profile — a detailed, fully customisable dashboard tailored to that individual. Crucially, the profile includes assigned Supplier User IDs, allowing support teams to accelerate ticket resolution without additional lookups.
This integration of segmentation, investigation, and operational validation in one interface is what separates it from static reporting tools. It is not just about generating charts; it is about enabling action within the same system. The USP is cohesion: insight, validation, and response within one operational ecosystem.
How does the dashboard support both retention and risk management simultaneously?
Retention and risk are often treated as separate functions, but in reality, they intersect constantly. For retention teams, early behavioural shifts matter. The KPI graph may reveal declining engagement. Game Overview charts can highlight reduced diversification or waning interest in preferred suppliers. Timeframe switching allows teams to compare short-term dips against longer-term patterns.
For risk and compliance teams, the same profile offers operational validation tools. Device breakdown, country and currency charts help identify inconsistencies. If a player historically logs in via mobile from the UK using GBP but suddenly accesses via desktop from Brazil using USD, that represents a clear anomaly.
The Flagged Activity panel centralises system-generated alerts such as failed winning credit or suspicious betting behaviour. Combined with the Game Rounds log, teams can cross-reference exact timestamps to determine whether gameplay appears organic or automated.
By housing retention signals and fraud indicators in the same view, the dashboard reduces siloed thinking. A sudden behaviour shift might indicate churn risk or compromised access. Unified analytics helps ensure the correct interpretation happens faster. This dual functionality makes the dashboard not only a growth tool, but a protective one.
What does this mean for the future of operator analytics?
The future of analytics in iGaming is less about generating more data and more about making it accessible. Operators managing multi-brand environments need visibility that adapts with scale, not reporting layers that multiply.
Unified dashboards represent a structural evolution. Rather than exporting data to external systems, operators increasingly expect intelligence to live inside their operational platforms. Embedded analytics reduces dependency on specialist teams and democratises insight across departments.
Hub88’s Player Analytics reflects this shift. Customisable chart blocks, flexible timeframes, saved segmentation, and integrated supplier ID visibility show how analytics can become a daily operational companion rather than a monthly reporting task.
For operators serious about retention, the competitive edge lies in speed: spotting churn before it happens, identifying fraud before it escalates, and aligning content strategies with real behavioural data.
As player acquisition costs rise and regulatory scrutiny tightens, operators who turn insight into immediate action will sustain long-term growth.