
Casino dashboard: February 2022

There was just the one new arrival in the January charts, Agent Jane Blonde Max Volume by Microgaming. Christmas Big Bass Bonanza by Pragmatic Play duly bowed out for the change of season, making room for Book Of Dead (Play’n Go) to return to the podium.
Top 20 games by distribution
Given this relative stability of game performance this month, we thought it worth giving you an insight into the evolution of game development and distribution this past year.
2021 game production and distribution: the year in review
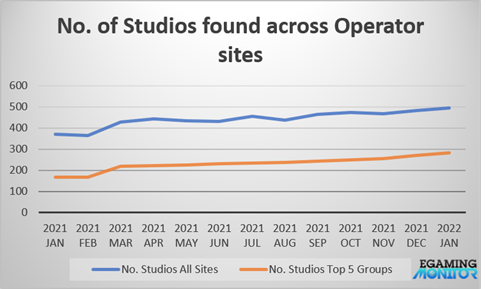
There has been an explosion in games found on operator sites. Our interactive chart above shows growth from 9,000 to 12,000 slots on the main casino pages of operators last year. This only paints half the picture, however. If we include all subpages and all game types, including live games, table games, scratchcards, video bingo etc., we now identify a whopping 19,000 unique games from nearly 500 studios each week (see chart below left)
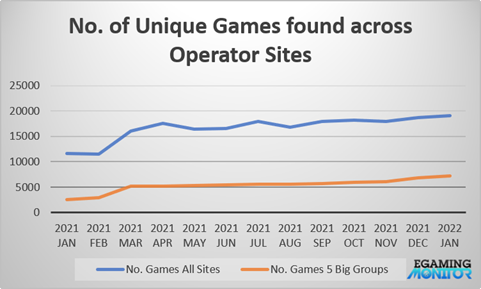
Granted, during this same period we increased the number of sites covered to 1,500, which in turn leads to more games discovered, especially from the slightly more obscure studios around the world.
Yet, if we just compare five of the big casino groups from this year to last, a clear picture of studio and game growth is still evident. These five groups now source nearly 8,000 unique games either directly or via aggregators, up from 2,300 last year. The range of studios they offer has rocketed too, from 170 to nearly 300 distinct providers (please note that the top five group data is drawn from all sites within a handful of selected operator groups: Flutter, 888, Aspire Global, Betsson and Entain).
Overall, the 500 studios we monitor each produce an average of one title per month. Undaunted by the volume of games and encouraged by the appetite of operators, new studios have also joined the fray. Around 50 new brands launched in the last 12 months including the diversified content arms of operators and aggregators.
At the same time, operators don’t tend to retire games, since many compete on breadth and depth of content. The result of all of this: a proliferation of games and an ever-dwindling share of “shelf space” per game, or per provider.
So… more studios, more studios per operator and more games in front of end-users. The sheer volume of data means that suppliers are finding it difficult to keep tabs on the distribution of their own games, or those they aggregate.
At the same time, operators now need effective tools to present the right subset of content to the right end-users and in the right order. Back in the day, when there were a couple of hundred titles to choose from, it was probably sufficient to provide the odd filter plus a “new games” section. A bit more sophistication came in the form of “if you like this game, then some of our other users also liked these too”.
However, this type of recommendation engine can be unsophisticated. The issues of cold start or data sparsity can lead to affirmation loops which entrench certain games and reduce game discovery. The massive increase in game numbers this year has exacerbated the problem.
Hybrid systems based not only on user data but also content features will prove more effective, just as they have across other digital sectors. A recommender system can be supercharged by adding a rich set of game content data, including game types, themes, colours and game features, for example. Some platform providers and operators we work with are starting to exploit this to present the stickiest content to users.
When AI tools and algorithms begin to truly “learn” which game suggestions produce the best results over time, data becomes your friend. Note that a very careful definition of “results” is needed here: an algorithm directed at improving engagement or LTV metrics will propose very different games to one which seeks to maximise GGR per player per hour, for example.
2021 dealmaking: the year in review
FBM Gaming have been plugging their content into one new platform per month recently and so now share top spot in our rolling six-month studio dealmaker chart.
Biggest studio dealmakers
Across the entire year, Red Rake and PariPlay were the busiest studios, extending their distribution to 10 new platforms, with PariPlay even rebranding their studio arm to Wizard Games.
In January, Slotegrator added new content from OnlyPlay and Slotmill, taking them to top spot in our busiest aggregator chart.
Biggest aggregator dealmakers
Looking at the full 12-month period, SoftSwiss topped the group with Salsa Technology and Slotegrator not far behind.
For context though, the only figure which reduced year on year is the total number of deals between studios and aggregators. 333 deals were concluded between studios and platform providers in 2021 vs 406 in 2020. This may surprise, given the growth in content on operator sites above….
It is possible that there was a Covid impact and dealmaking may yet recover. Alternatively, a combination of bloated aggregator pipelines and the desire for higher margins may have sparked a counter trend towards more direct studio/operator integrations. While anecdotally, we have heard a few examples of this, there is nothing to suggest a trend here, however.
Perhaps more likely is that the frantic efforts of studios and aggregators have peaked and we could be witnessing the maturing of our distribution network. Last year’s phenomenal volume of studio -> platform integrations may have resulted in this year’s exponential growth in content across operator sites.
Or, it may also be a case of diminishing returns for aggregators: integrations cost time and resource, both for set-up and maintenance. The value of adding another studio to their portfolio may be limited, especially when some operators have access to that same studio via another aggregator.
Finally, it may reflect the pressures that both studios and platforms now face, tailoring either game mechanics or content delivery engines to the patchwork of regulations across the globe. One for Agent Jane to decipher perhaps? Would love to hear your thoughts!
* Please note these are live charts which update every month so please ensure the month of January 2022 is selected in the drop-downs to match the analysis
**The interactive games chart at the top excludes live games and table games. Game rankings are determined by the number of game appearances on the casino homepages of more than 1,400 casino sites. To access many other charts including game rankings, live and table games, positions on subpages or to filter game performance by game theme, game feature or by operator type, get in touch with Egamingmonitor.com. Egamingmonitor covers 37,000 games, 1,300 suppliers and 1,500 operators.
*** The unique games and studio charts are based on the wider dataset of more than 4,000 pages from 1,500 operator sites and also include all game types, including live games, table games, video bingo, video poker, scratchcards, crash games and more.
****Data on deals by month was collected from April 2020 onwards and the rolling chart reflects current dealmaking performance, i.e. how many deals were signed over the last six months. Deals between companies from all time are available via Egamingmonitor.com. Note that only deals either a) on company websites or b) in the gaming press or c) reported to us by studios and aggregators, are collated.